5.6 Compare download counts with the number of commits on master branch
In this section, we compared total downloads over the most recent 6 month period, with the number of commits on master branch in Github repositories. For all of CRAN R-packages, there were only 6185 R-packages that have Github repositories, and after cleaning up, only 5769 remained.
Finding: In our initial assumption, more commits on master branch of Github repositories are likely to bring R-packages more download counts. On the one hand, the number of commits can indicate that developers are constantly supplementing and updating their R-packages, which may lead to more downloads. On the other hand, the number of commits also can reflect the attention developers attach to their R-packages, to some extent. Usually, for those who have more commits, their developers may advertise more or try other ways, to expand the popularity and improve the download counts.
The way we initially planned to apply was extracting the commits through accessing the Github REST API(“GitHub REST API” 2021). To achieve that, we first scraped the Github URLs from ‘description’ pages for all of R-packages from CRAN, then cleaned up the multiple URLs and other redundant symbols or characters. The URL is formatted as : “https://api.github.com/repos/{user_repo}/commits?per_page=1”. For example, the URL for package tidyverse can be like : “https://api.github.com/repos/tidyverse/tidyverse/commits?per_page=1”. Practically, by replacing the user_repo part that consists of the name of the related repository and the name of the package holder, we could access the contents of URLs through Github API, for all of CRAN R-packages.
Based on that, Table 5.12 shows the first 5 R-packages, with their Github URLs and the user_repo parts.
However, the Github API has a rate limits, allowing for up to 60 requests per hour for unauthenticated requests, which can be extended to 5000 per hour after authentication(“GitHub REST API” 2021). But even after getting authentication, our rate limit didn’t get promoted. So, we switched to scrape commits with Python spider, by setting random user agent, to avoid the API limit. Since this method is quite time consuming (around 5 hours each time for all available R-packages), we saved the output as a local .txt file and load it later in R studio, to speed up the code execution.
| package | URL | user_repo |
|---|---|---|
| abbyyR | http://github.com/soodoku/abbyyR | soodoku/abbyyR |
| ABCoptim | http://github.com/gvegayon/ABCoptim | gvegayon/ABCoptim |
| abctools | http://github.com/dennisprangle/abctools | dennisprangle/abctools |
| abdiv | http://github.com/kylebittinger/abdiv | kylebittinger/abdiv |
| abess | http://github.com/abess-team/abess | abess-team/abess |
Table 5.13 shows the first 5 R-packages of all, along with their total downloads over the most recent 6 month period, and the numbers of commits on master branch in Github repositories.
| package | commits | total |
|---|---|---|
| rlang | 4,427 | 14748569 |
| dplyr | 7150 | 12054840 |
| ggplot2 | 4,756 | 11825489 |
| lifecycle | 206 | 10438007 |
| tibble | 4,286 | 10340887 |
Figure 5.14 shows the scatterplot, along with a smoothing line. In general, more commits can link to more downloads.
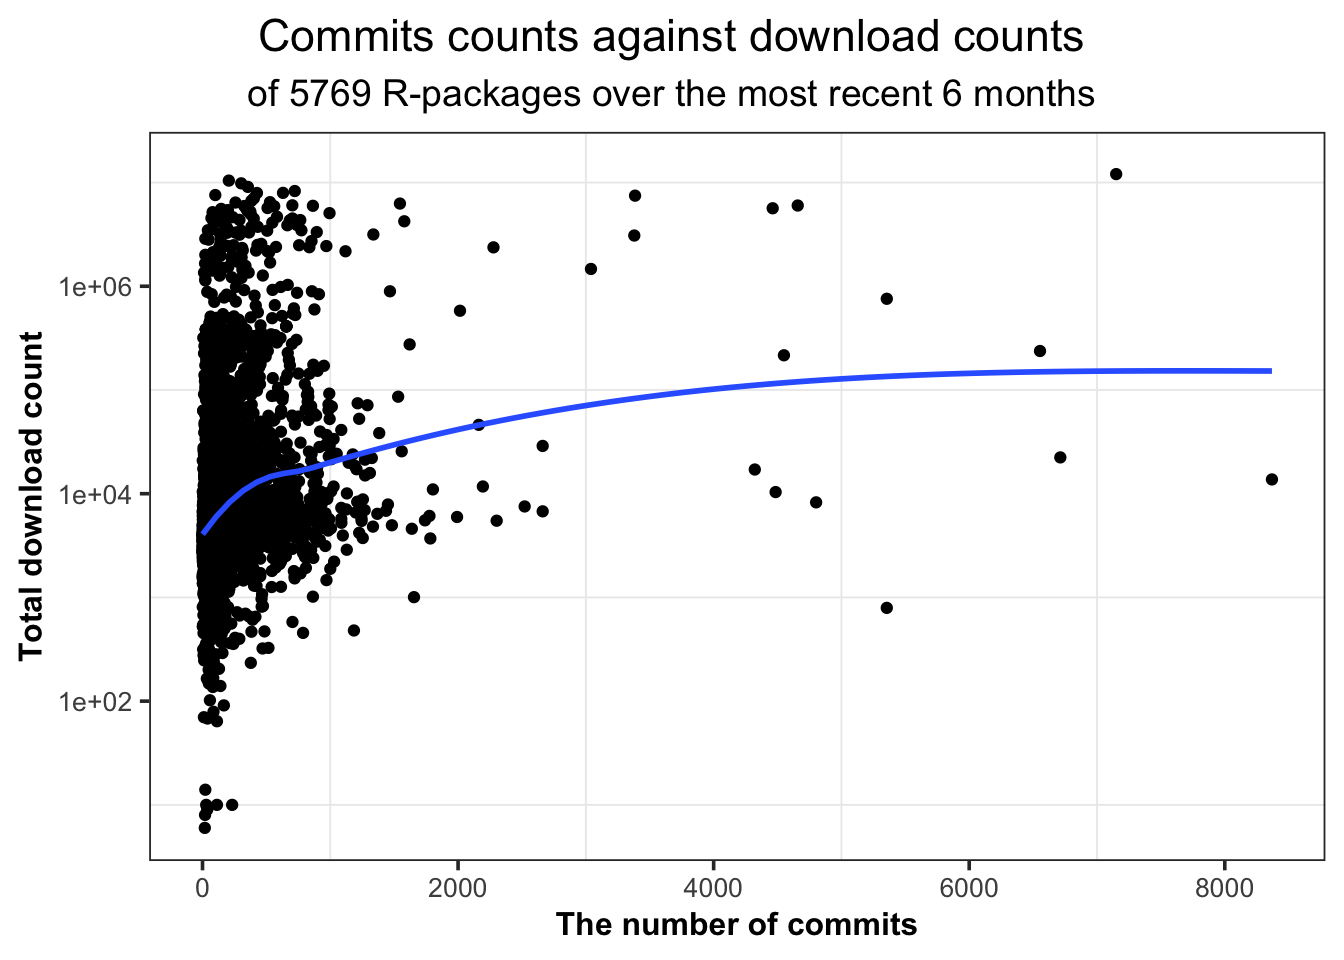
Figure 5.14: The commits on master branch in Github repositories against the total download counts over the most recent 6 month period.
Another method can be conducted by taking the ultra-low-downloaded R-packages into consideration, whose download counts only rank last 1% of all. Another purpose for this way is to show our initial idea on scraping commits through Github API with R (as the sample size is less than 60 R-packages, on this condition).
Table 5.14 shows the last 10 quantiles of download counts, it can be seen that the last 1% download count is around 375.16. As the download counts of those packages are extremely low, we could assume that many factors can have little effect on their downloads, and the only two differences among them are the numbers of commits on Github master branch and the total download counts.
Based above, we could select those ultra-low-downloaded R-packages and extract commit counts from their Github repositories. In Figure 5.15, it could be observed that when the number of commits increases from 0 to 100, the download counts first increase and then decrease. After that, the download volume keeps rising, with a small jump at the end. We consider that might result from the too small-sized sample, and the observation causing the decline can be an outlier. If expanding the observation horizon, an increase in this curve can be expected. Therefore, it can be concluded that even for those last 1% downloaded R-packages, the phenomenon - “the more commits can link to more downloads” also exists.
| download_count | |
|---|---|
| 0% | 0.00 |
| 1% | 375.16 |
| 2% | 721.58 |
| 3% | 1075.37 |
| 4% | 1340.32 |
| 5% | 1562.85 |
| 6% | 1674.00 |
| 7% | 1804.53 |
| 8% | 1903.32 |
| 9% | 1968.11 |
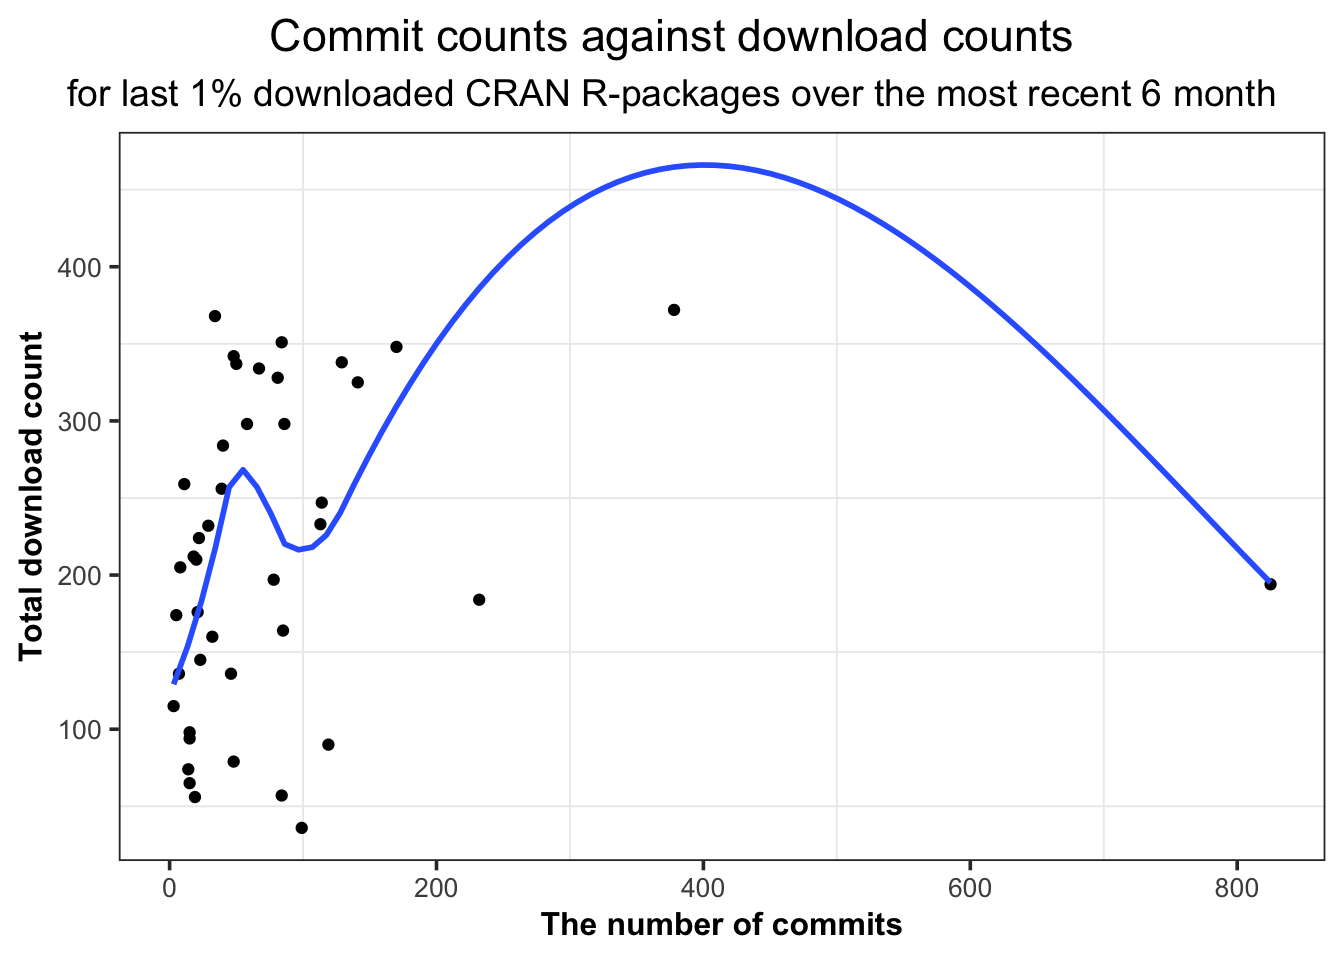
Figure 5.15: The commits on master branch of Github repositories, against the total download counts over the most recent 6 month period, for last 1% downloaded R-packages on CRAN.
correlation test
First, we should verify the test assumption—the distribution of the variables—before selecting an appropriate correlation test. The Shapiro-Wilk test results in Table 5.15 indicate that the p-values for both commits and total are less than 0.05, indicating that their distributions are all non-normal. Additionally, the QQ-plot 5.16 confirms that those variables deviate significantly from the normal distribution. As a result, the Spearman or Kendall correlation test should be used.
| Variable | W.value | p.value |
|---|---|---|
| commits on github | 0.4312253 | 3.155336e-82 |
| total downloads | 0.1487795 | 4.933290e-92 |
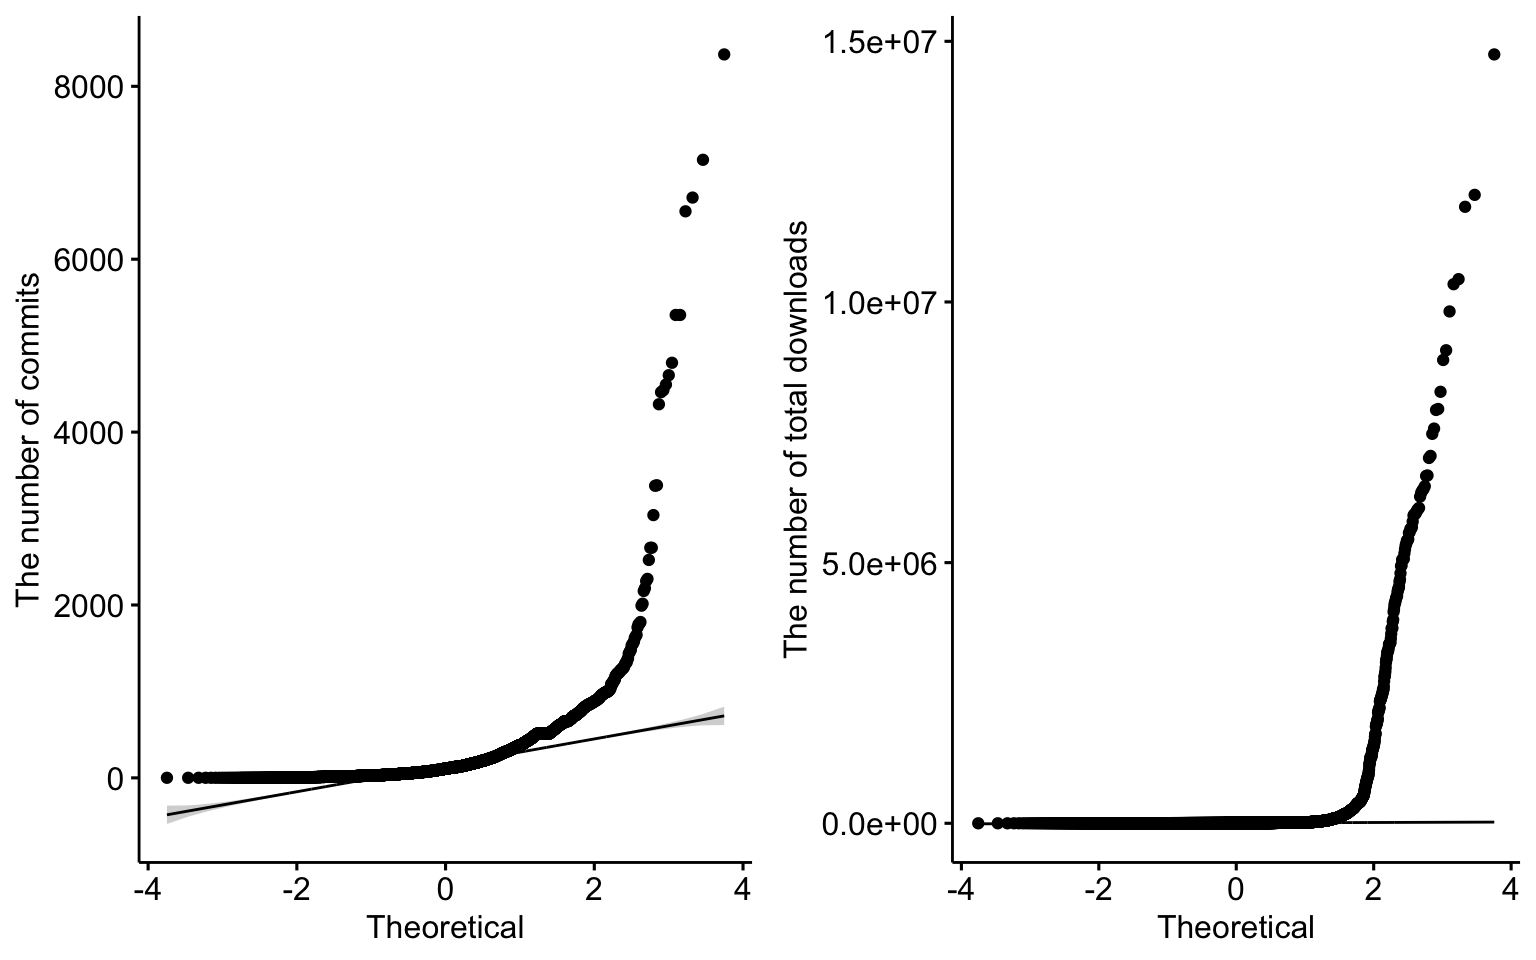
Figure 5.16: QQ-plot for the number of commits on master branch in Github and the total downloads.
The Kendall rank correlation and Spearman’s correlation for the number of commits on Github’s master(main) branch and total downloads, respectively, can be seen in Tables 5.16 and 5.17. We can see that the p-values are rounding to 0 and 0, which are both less than 0.05, revealing that the relationship between commits and downloads is statistically significant at a 5% confidence level. The estimate coefficients are 0.24 and 0.35, indicating that those two variables have a weak positive correlation. Consequently, we could conclude that the cumulative download count increases between 0.24 and 0.35, as the number of commits on Github’s master(main) branch increases per unit.
| Z.score | tau | P.value |
|---|---|---|
| 26.48 | 0.24 | 1.50516755781972e-154 |
| S.score | rho | P.value |
|---|---|---|
| 18754296134.1 | 0.35 | 2.52355299752742e-161 |
Figure 5.17 and Figure 5.18 shows the scatterplots, together with correlation estimate coefficients, respectively.
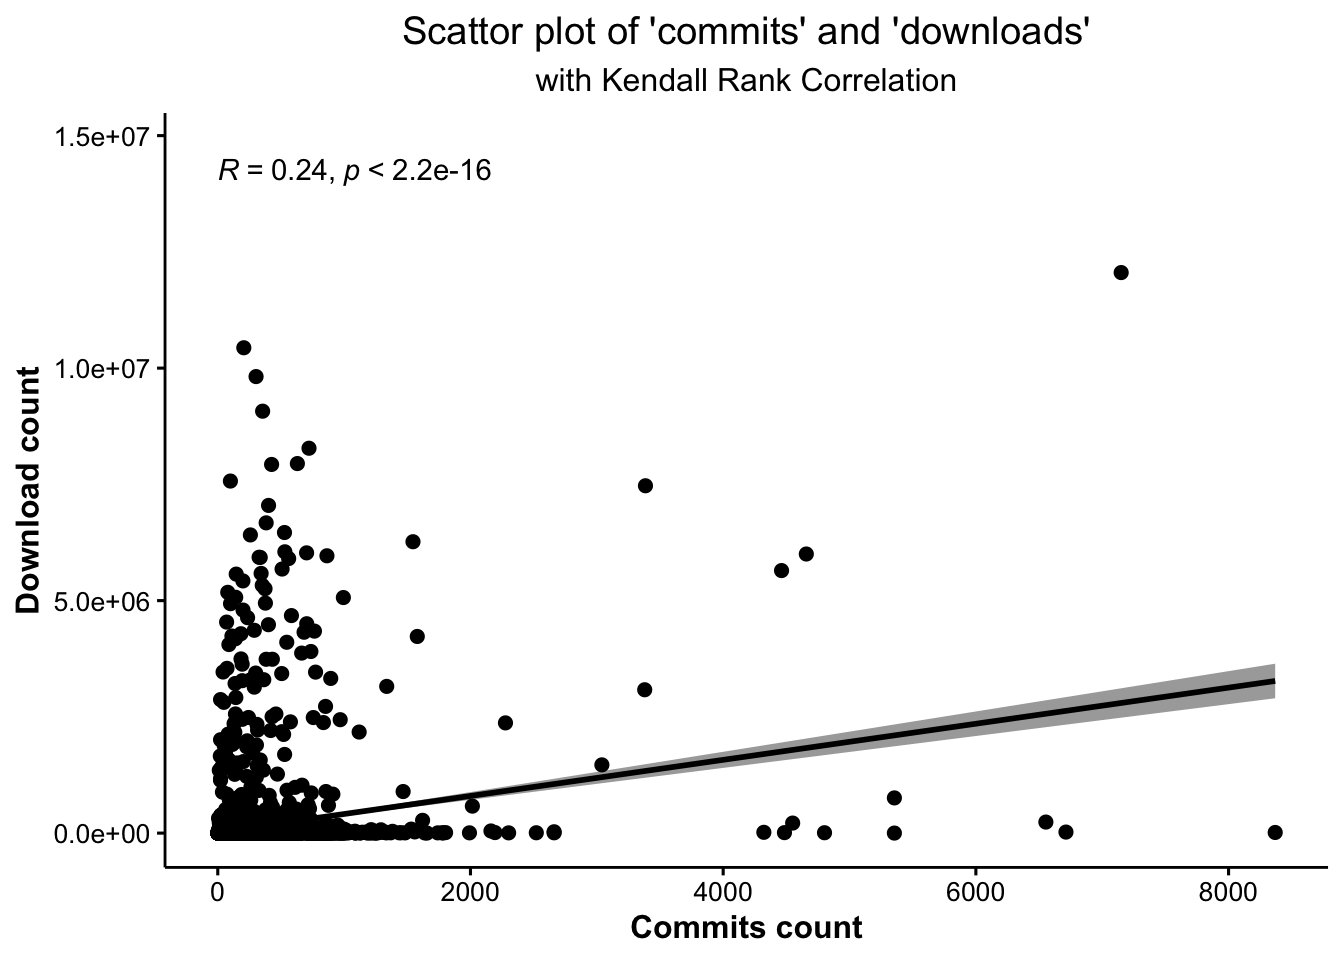
Figure 5.17: There is an weak potive relationship between the number of commits on master branch in Github and the cumulative download count, significantly at a 5% confidence level.

Figure 5.18: There is an weak potive relationship between the number of commits on master branch in Github and the cumulative download count, significantly at a 5% confidence level.