5.7 Compare download counts with the numbers of updates
In this section, we looked into the relationship between the numbers of updates and total download counts over the most recent 6 month period, for all of CRAN R-packages.
Finding 1: The download counts tend to rise with the numbers of updates. This is probably because there will be a significant increase in downloads when packages get updated. During that time, not only old users often download the latest version, but also it is easier to attract new users, for the increase of downloads within a short period of time can bring packages up to the trending list(R-Hub, n.d.).
Figure 5.19 shows that the numbers of downloads increase with the update times. And most R-packages are updated no more than 30 times.
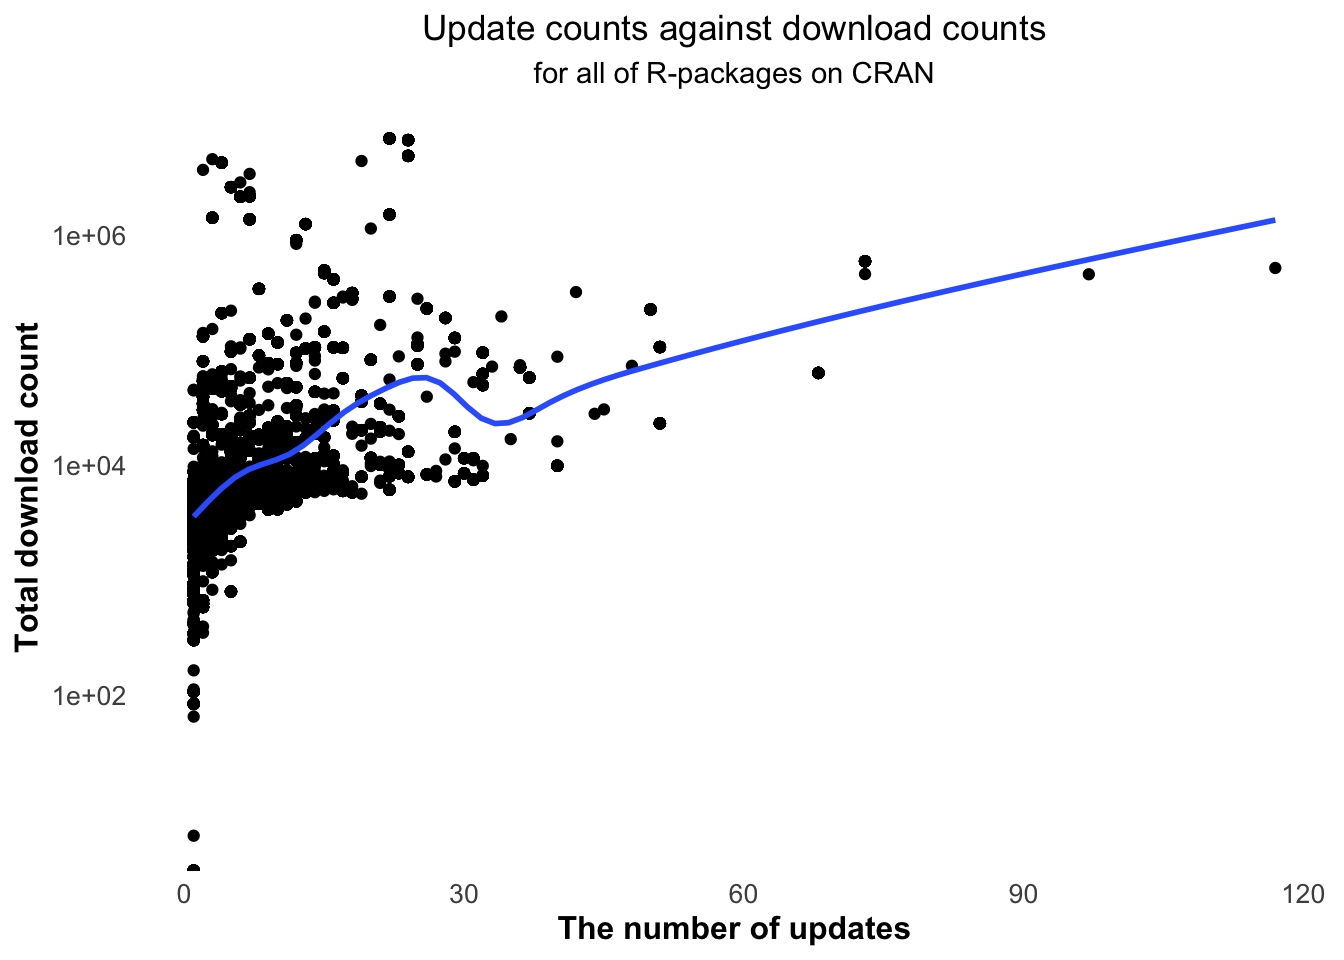
Figure 5.19: The download counts increase with the numbers of updates.
Finding 2: Over half of the CRAN R-packages are not likely to update very frequently.
By checking Table 5.18, we can know that the percentage of R-packages whose updates are less than average is 70.2920266 %, which means much more than half of the CRAN R-packages do not tend to update very frequently.
| number of packages with low updates | percentage of packages with low updates |
|---|---|
| 11963 | 70.29203 |
Finding 3: Most CRAN R-packages keep updating with the time, probably to keep its activity.
It can be seen from Figure 5.20 that most R-packages’ latest publish dates are after 2015, which indicates that many R-packages are likely to update with the time, probably in order to keep their activity.
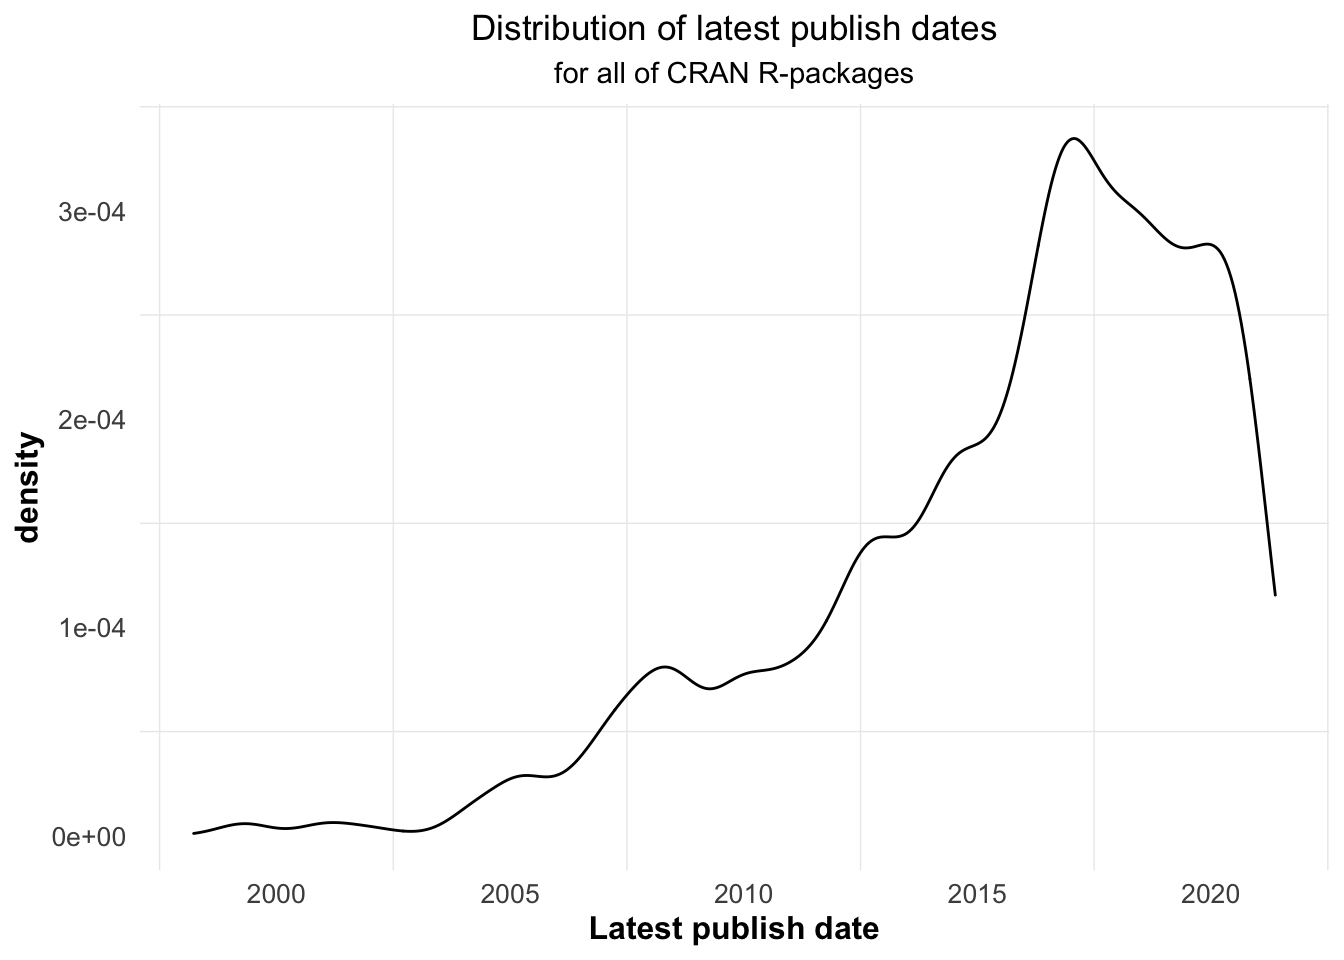
Figure 5.20: The latest update dates of CRAN R-packages are almost the recent dates.
Finding 4: Most of the CRAN R-packages are likely to update with a relatively long time interval.
Figure 5.21 shows that with the increase of update intervals, the numbers of downloads first increase and then decrease slightly. Most of the time intervals are between 45 and 450 days, which shows that their update frequency is not very high.
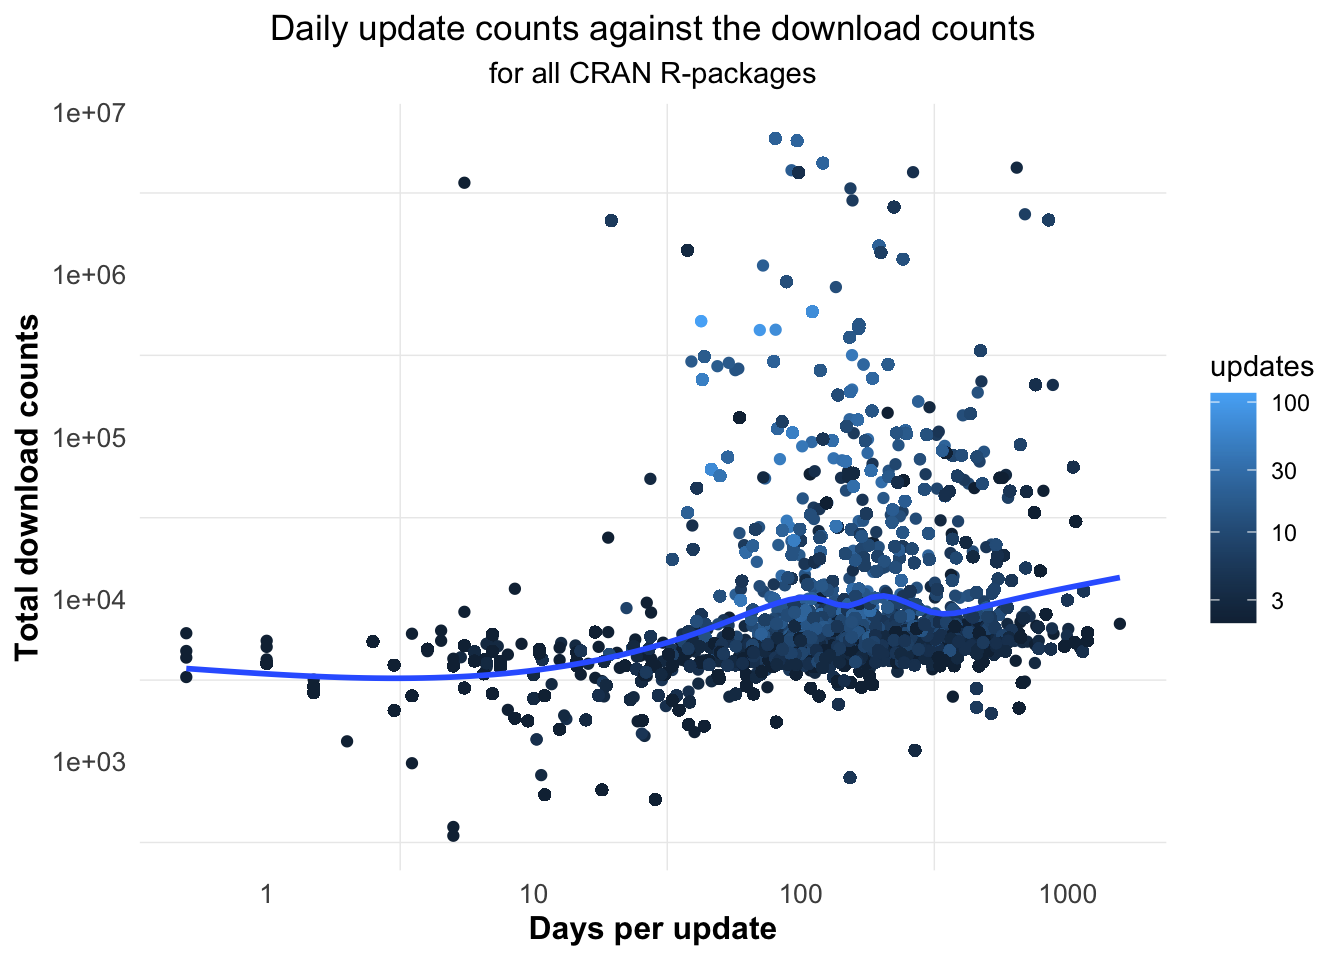
Figure 5.21: Most of the time intervals for updates are between 45 and 450 days.
In conclusion, it’s not that the more updates R-packages have, the popular they can be. In actual, most of the CRAN R-packages whose updates are lower than average occupy the majority. Therefore, the numbers of updates are probably not that important for R-packages. The really important thing can be keeping updated along the time.