5.3 Daily top 15 downloaded R-packages
In this section, we studied the top 15 downloaded R-packages from 2013-04-01 to 2021-04-01, to see how user preferences have been changing. The data were obtained from CRAN website [http://cran.rstudio.com/web/packages/packages.rds].
We are supposed to know that some R-packages are hold by Rstudio, some are developed by core personnel or personnel closely related to R, and some are created by prolific developers(“The Most Prolific Package Maintainers on CRAN” 2018). And there are also parts of R-packages that are dependency packages of others, which means the increasing downloads of their “father” packages would also promote the downloads of them. For example, R-package fable is dependency package within R-package fpp3. When users install fpp3, fable would also be installed at the same time. Naturally, the numbers of downloads for those packages can probably be higher. On the one hand, the R-packages developed by those experienced developers may be more mature and completed. On the other hand, users are more inclined to use packages produced by famous authors, which can be regarded as a kind of “good use” guarantee.
However, the existence of those packages can cause the results of user preferences biased. Therefore, we decided to explore the R-packages constructed by non-special creators, and screened out four types of R-packages, namely:
- R-packages maintained by R studio
- R-packages created by authors from R core group
- R-packages created by authors from R secondary group
- R-packages created by R related authors
- R-packages created by top 20 prolific maintainers (This is resourced at “The Most Prolific Package Maintainers on CRAN” (2018))
After that, we generated a lorenz curve here again in Figure 5.9, it can be observed that the distribution of R-packages in each download group is more equal now and the Gini value decreases as well, for the ‘extreme effect’ brought by highly-downloaded packages has disappeared. Thus, the user preferences could be shown more clearly. However, after filtering, the number of remaining R-packages is only 58, which is a too small-sized sample to conduct representative conclusions, we would still focus on all of R-packages on CRAN in later analysis.
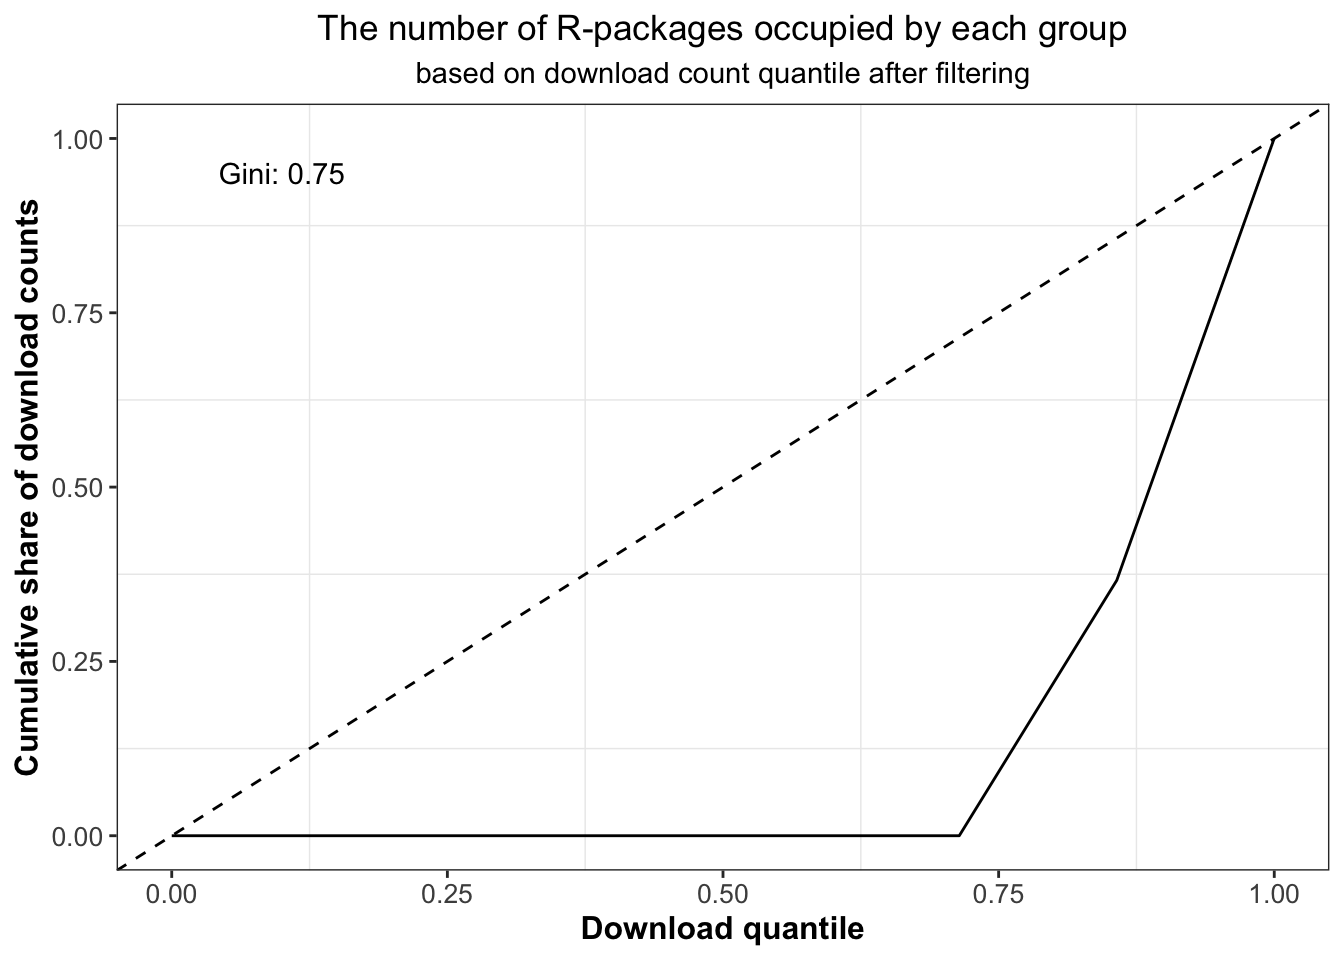
Figure 5.9: Percentiles of the download counts against cumulative download counts of R-packages after filtering four types of popular and highly-downloaded packages.
Finding 1: The topic of newly added R-packages come from quite different application areas, each year.
Table 5.9 shows the R-packages that newly come up to the top 15 list each year, from which we can know how the user preferences have changed year by year, compared with the previous year. To be more specific :
- For 2014,
ncdfranks first, which is used to provide an interface to netCDF format data. - For 2015, the first downloaded R-package is
XLConnectJars, related to JAVA dependency. - For 2016, the first downloaded R-package is
reports, for standardising the output of R. - For 2017,
lava.tobitaims to help with estimation and simulation of latent variable models. - For 2018, the first-ranking
ReportsRsis for creating Microsoft Word and Powerpoint documents. - For 2019,
CALIBERrfimputeis used to impute missing values in analysis datasets using full conditional specifications. - For 2020,
SparkRis similar todplyrbut for large datasets. - For 2021,
heatmap.plusis an extension ofheatmap()function.
| package14_13 | package15_14 | package16_15 | package17_16 | package18_17 | package19_18 | package20_19 | package21_20 |
|---|---|---|---|---|---|---|---|
| ncdf | XLConnectJars | reports | lava.tobit | ReporteRs | freetypeharfbuzz | ENmisc | heatmap.plus |
| playwith | KoNLP | moonsun | rggobi | OceanView | replyr | CoxBoost | lazyrmd |
| DMwR | doRedis | rPython | alr3 | ReporteRsjars | zipcode | gWidgetstcltk | packagedocs |
| latticist | ElemStatLearn | rmongodb | tnam | gWidgetsRGtk2 | rmosek | citr | robcp |
| bstats | testthatsomemore | maxent | SweaveListingUtils | d3heatmap | msgpack | EMMIXskew | skedastic |
| geoRglm | adehabitat | SDMTools | ElemStatLearn |
|
|
RcmdrPlugin.mosaic | nws |
| reports | wmtsa | MSBVAR | zipcode |
|
|
RcmdrPlugin.qual | SpaDES |
|
|
mixOmics | d3heatmap |
|
|
|
OceanView | SpaDES.core |
|
|
DatABEL | ReporteRs |
|
|
|
|
bomrang |
|
|
|
|
|
|
|
|
snipEM |
|
|
|
|
|
|
|
|
SpaDES.addins |
|
|
|
|
|
|
|
|
swissdd |
|
|
|
|
|
|
|
|
tmg |
Finding 2: The topic of R-packages changes least during 2017 and 2019. The most popular application filed is on JAVA dependency.
Table 5.10 shows the R-packages that remain unchanged each year, compared to the previous year, from which we can know which packages are relatively stable in popularity.
To be more specific, packages like XLConnectJars, DMwR, KoNLP, and gWidgets are relatively popular through years from 2014 to 2021. They are used for providing JAVA dependency, data mining, linguistic research and providing API for building toolkit-independent, interactive GUIs.
| package14_13 | package15_14 | package16_15 | package17_16 | package18_17 | package19_18 | package20_19 | package21_20 |
|---|---|---|---|---|---|---|---|
| Defaults | ncdf | XLConnectJars | XLConnectJars | XLConnectJars | XLConnectJars | freetypeharfbuzz | freetypeharfbuzz |
| RSQLite.extfuns | epicalc | KoNLP | KoNLP | DMwR | KoNLP | DMwR | OceanView |
| gWidgetsRGtk2 | gWidgets | DMwR | DMwR | KoNLP | DMwR | gWidgets |
|
| gWidgets | gWidgetsRGtk2 | gWidgets | reports | SDMTools | SDMTools | d3heatmap |
|
| alr3 | DMwR | mixOmics | maxent | reports | gWidgets | alr3 |
|
| epicalc | alr3 | gWidgetsRGtk2 | SDMTools | mixOmics | ElemStatLearn | gWidgetsRGtk2 |
|
| rggobi |
|
|
mixOmics | ElemStatLearn | reports | reports |
|
| its |
|
|
gWidgets | alr3 | gWidgetsRGtk2 |
|
|
|
|
|
|
|
maxent | d3heatmap |
|
|
|
|
|
|
|
gWidgets | alr3 |
|
|
Next, we changed the object to trending R-packages. Trending R-packages are ones downloaded at least 1000 times last week, which have increased significantly compared to the average weekly downloads in the previous 24 weeks(R-Hub, n.d.). That is to say, they are packages with significantly high download volume in a recent short time. Through their topics, we can know what application areas of R-packages that people are concerned about recently.
Finding 3: The most popular topic of trending R-packages.
Table 5.11 shows the top 10 downloaded topics for trending R-packages. The most popular topic is WebTechnologies, followed by Multivariate and TimeSeries. This is easy to understand : the numbers of users from different fields are different, so the downloads of R-packages in different topics also varies. It seems that WebTechnologies is quite heated recently.
| topic | download times |
|---|---|
| WebTechnologies | 5 |
| Multivariate | 4 |
| TimeSeries | 4 |
| Cluster | 2 |
| Distributions | 2 |
| ExperimentalDesign | 2 |
| Phylogenetics | 2 |
| SocialSciences | 2 |
| Finance | 1 |
| gR | 1 |
Apart from the topics of R-packages, what other factors can probably be linked to download volumes? With this question in mind, we then explored the relationship between the total number of download counts for all of CRAN R-packages and the earliest release date in the past year. We also studied the relationship between the total download volume and the number of updates, the number of commits on master (main) branch in GitHub repositories, the lengths and the alphabetical order of names, over the most recent 6 month period, in the following sections.