5.9 Compare download counts with alphabetical order of name
We might also have such experiences in our life. For example, when we go shopping in the supermarket, the goods placed in front of the shelves will be easier to attract our attention and be selected by us, because we may no longer want to seek products with similar functions for a long time.
From the perspective of R-package name, in addition to the length, is the alphabetical order of the first letter also linked the download volume? For R-packages with earlier alphabetical order will be placed at the first part of the R-package list on CRAN(“Available CRAN Packages by Name,” n.d.). To answer this question, we grouped the R-packages by 26-letter order, calculated the average downloads of each group, and then made comparison.
Finding 1: For all R-packages, the average downloads of different alphabetical group are slightly increasing by its order, while the total download tends to decrease a little, instead.
From Figure 5.22 we could see that the average downloads of different alphabetical group are slightly increasing by alphabetical order, while the total downloads tends to decrease a little, instead. This is because the later-ordered group contains fewer R-packages. It can be seen that developers may prefer to name their packages with a top alphabetical order, which might be easier for users to notice.
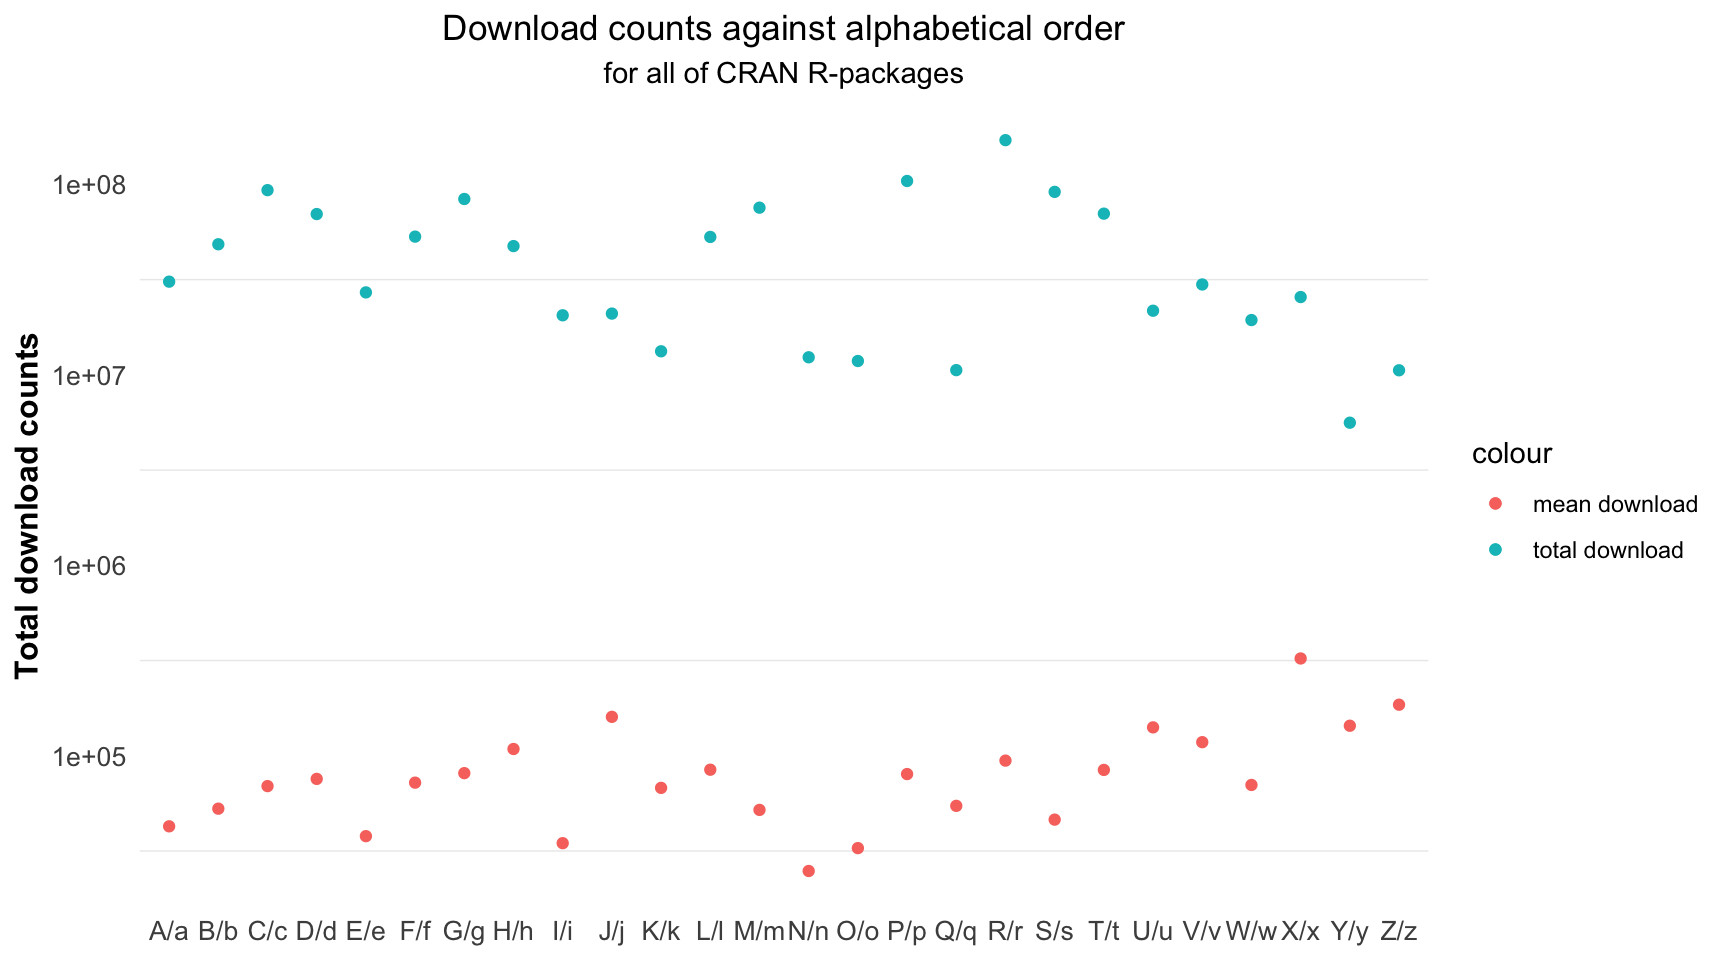
Figure 5.22: The average total download count of each group is little linked to the alphabetical order of R-package name.
Finding 2: For all R-packages on CRAN, the group with higher total download tends to have greater variance, owing to more outliers.
Then, let’s take a look for how the variance varies across groups. Figure 5.23 shows the data range and the median value for each alphabetical group. It can be seen that the group “R/r” has the highest outlier and the group “X/x” has the largest variation. At the same time, we could also see that the variance between different groups is not very obvious, which means that for each group, 50% of the R-package download count is relatively concentrated. The real difference is the highest and lowest downloads per group. In general, the larger the total number of downloads (which also means the more packages in the group), the more outliers will be included, such as group “F/f,” “L/l” and “R/r.”
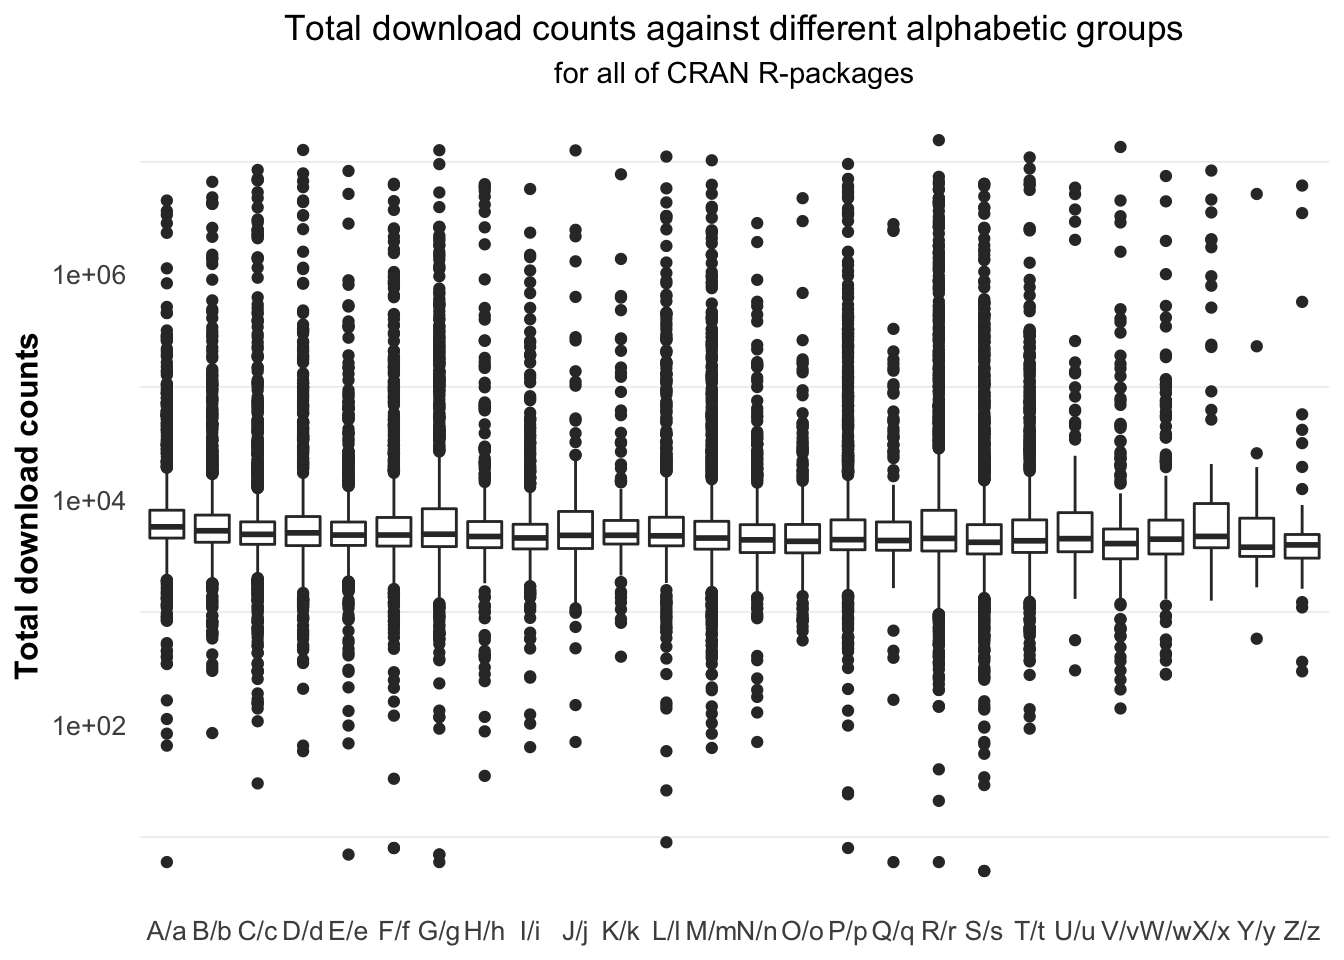
Figure 5.23: The R-packages with name starting with “j” has the largest variation.
In order to further verify our conclusion, we turned to the ultra-low-downloaded R-packages. As we have mentioned previously, when it comes to the ultra-low-downloaded R-packages, we could approximately assume the only variable that may affect the amount of downloads is name order here. From Figure 5.24, we could see that the difference in median download count of each alphabetical group is not significant as we expected.
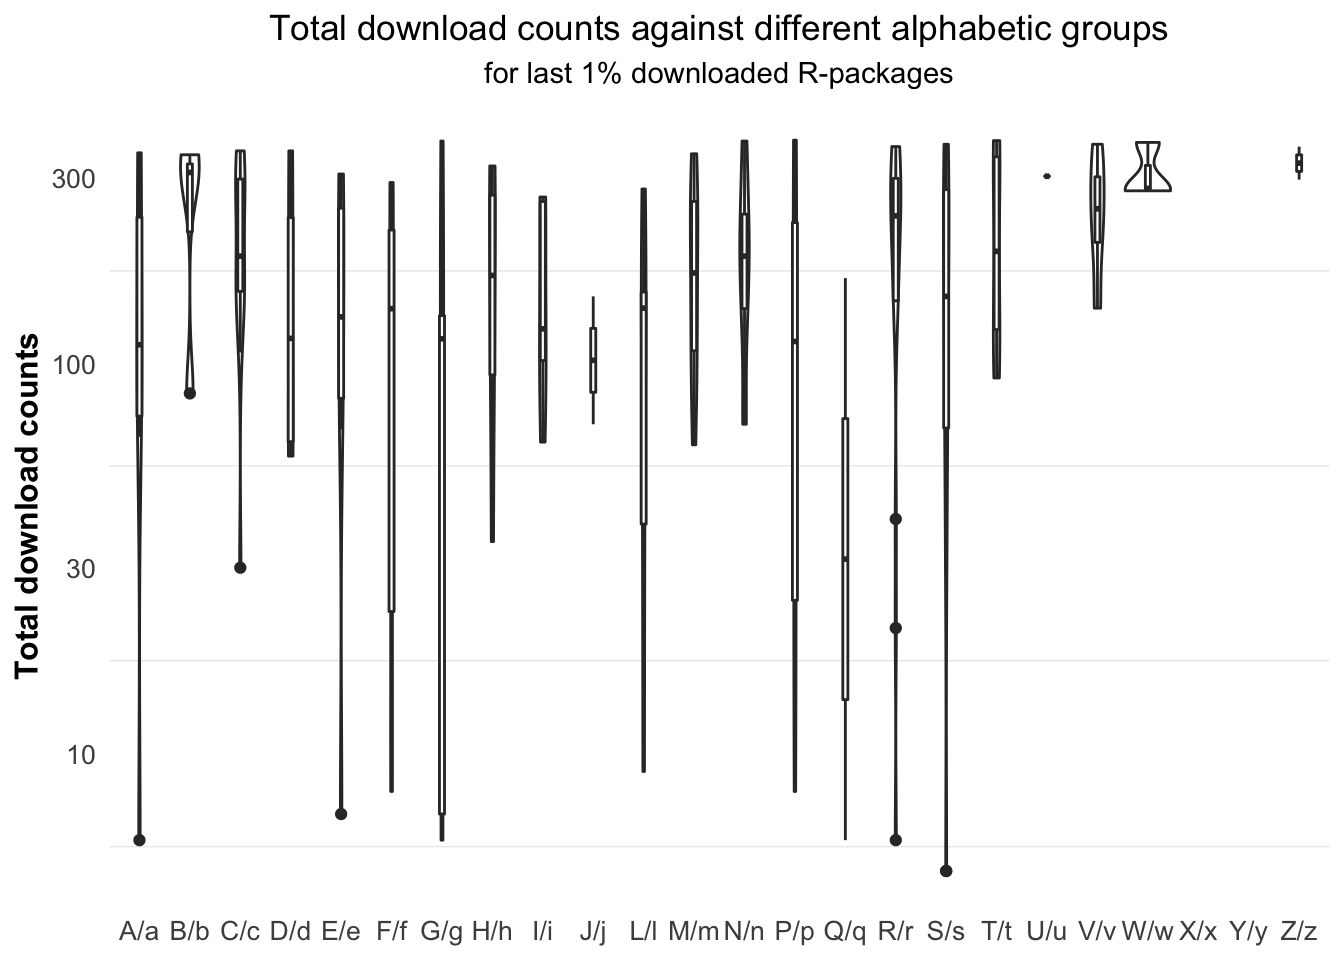
Figure 5.24: (ref:random-boxplot)
Therefore, we could approximately draw a conclusion : In general, the R-packages with the top alphabetical order are easier to get relatively high download volume, but the gap is not significant. At the same time, the higher the number of downloads, the greater the variance will appears in this group.