5.7 Compare download counts with the number of updates
Next, let’s look at the relationship between the number of updates and the number of downloads. In this part, our analysis object is still all the packages.
Finding 1: The download count tends to rise with the number of updates.This is because as we have known before, when a package is updated, there will be a significant increase in the number of downloads. That is to say, when a package is updated, not only old users will download the latest version, but also it is easier to attract new users at this time, for the increase of downloads in a short time may bring it into the trending list.
Figure 5.16 shows that the number of downloads increases with the update times. And most R-packages are updated no more than 30 times.
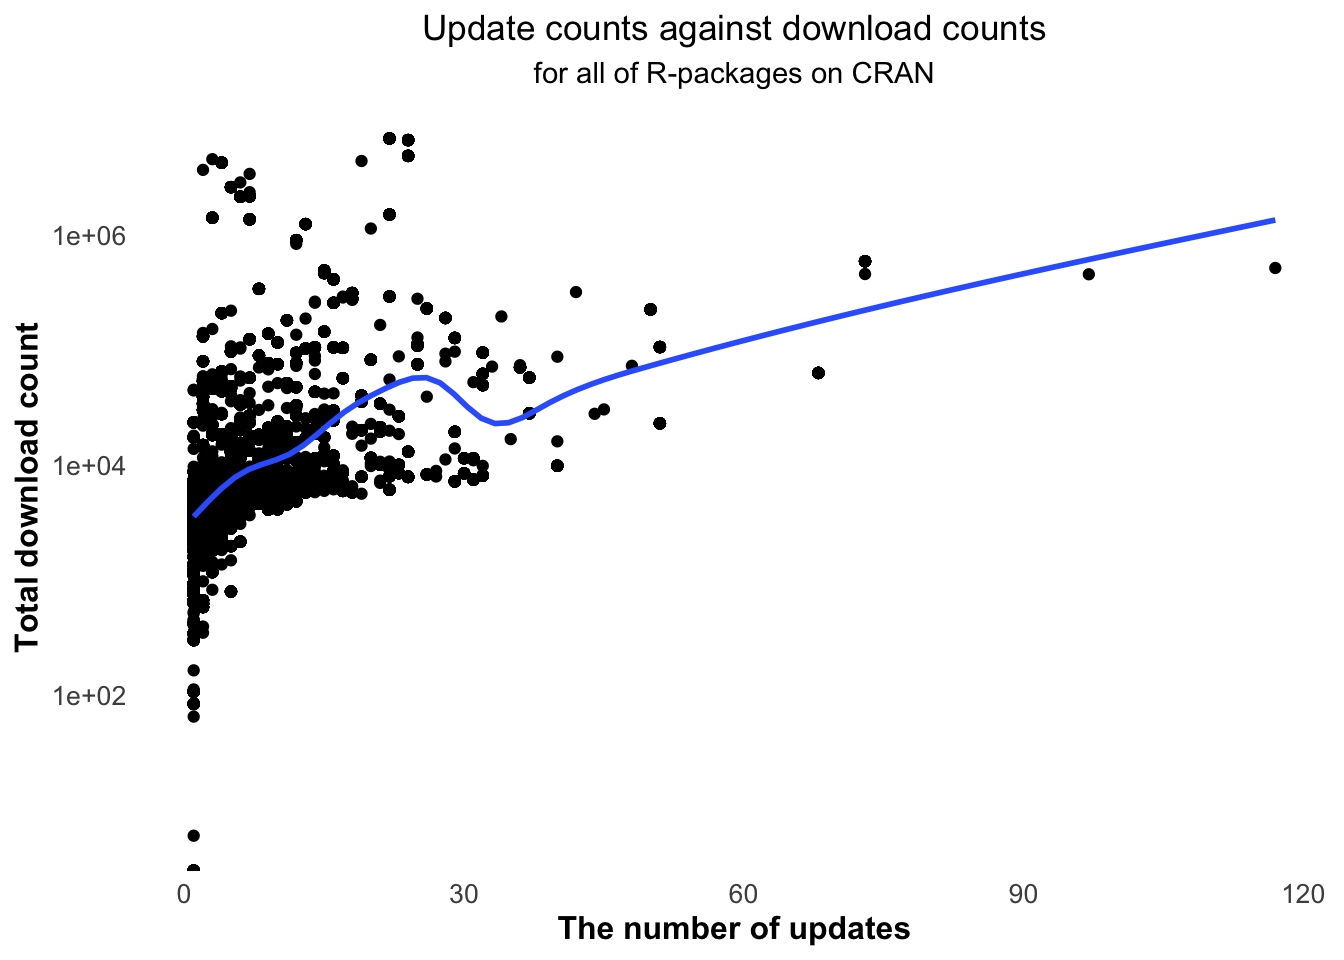
Figure 5.16: The download count increase with the number of updates.
Finding 2: Over half of the R-packages don’t tend to update very frequently.
Also checking Table 5.16, we can know that the percentage of R-packages whose updates are less than average is 70.2920266 %, which means much more than half of the R-packages do not tend to update very frequently.
| number of packages with low updates | percentage of packages with low updates |
|---|---|
| 11963 | 70.29203 |
Finding 3: Most R-packages keep updating with the time to keep its activity.
It can be seen from Figure 5.17 that most R-packages’ latest publish date is after 2015, which indicates that many R-packages tend to update by time to keep its activity.
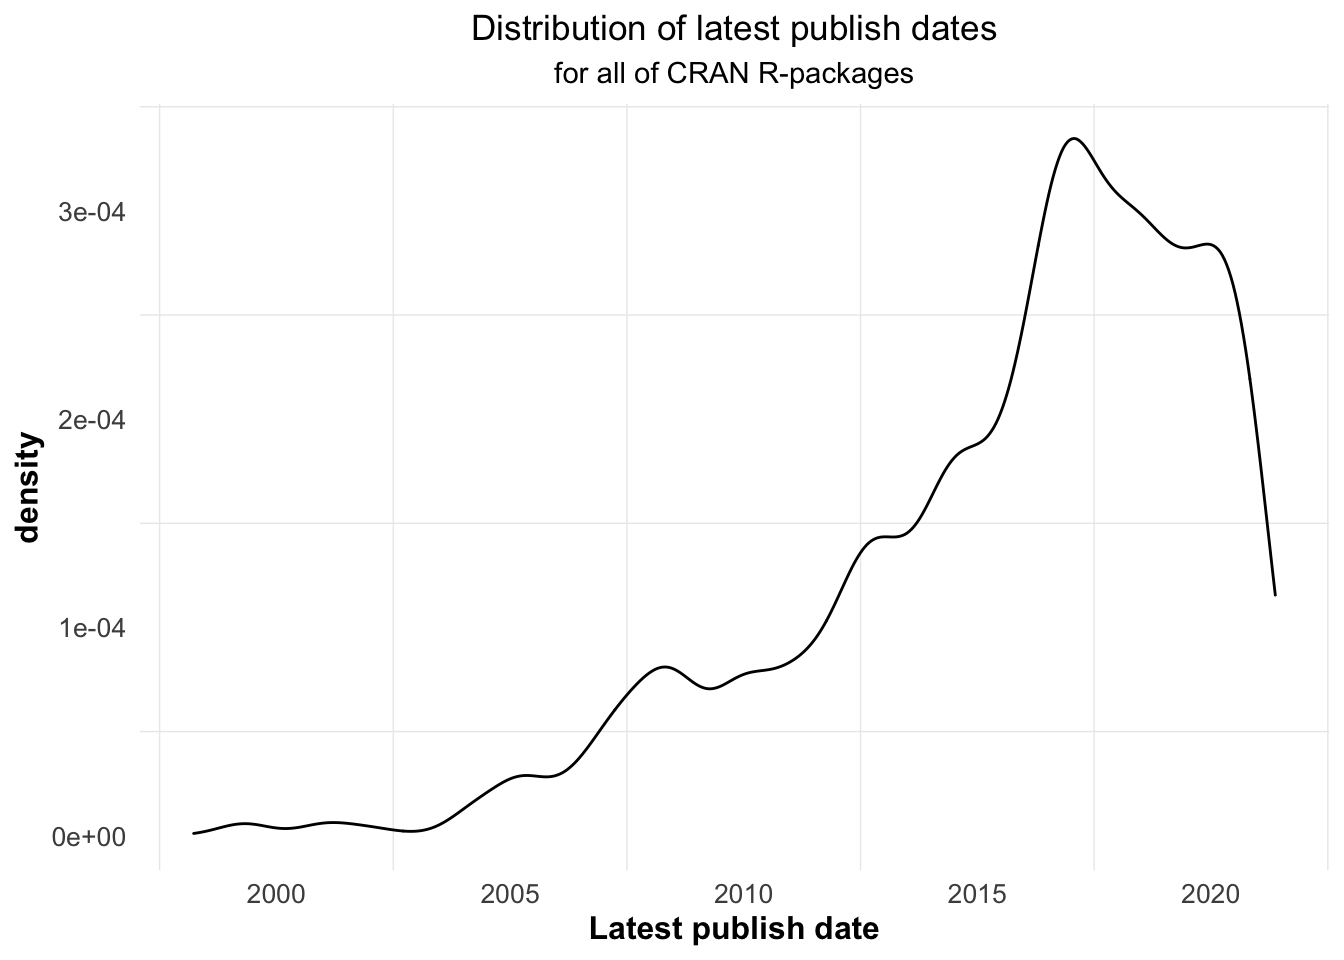
Figure 5.17: The latest update dates of trending R-packages are almost all the recent dates.
Finding 4: Most of the R-packages are likely to update at a longer time interval.
Figure 5.18 shows that with the increase of update interval, the number of downloads first increases and then decreases slightly. And most of the time intervals are between 45 and 450 days, which shows that their update frequency is not very high.
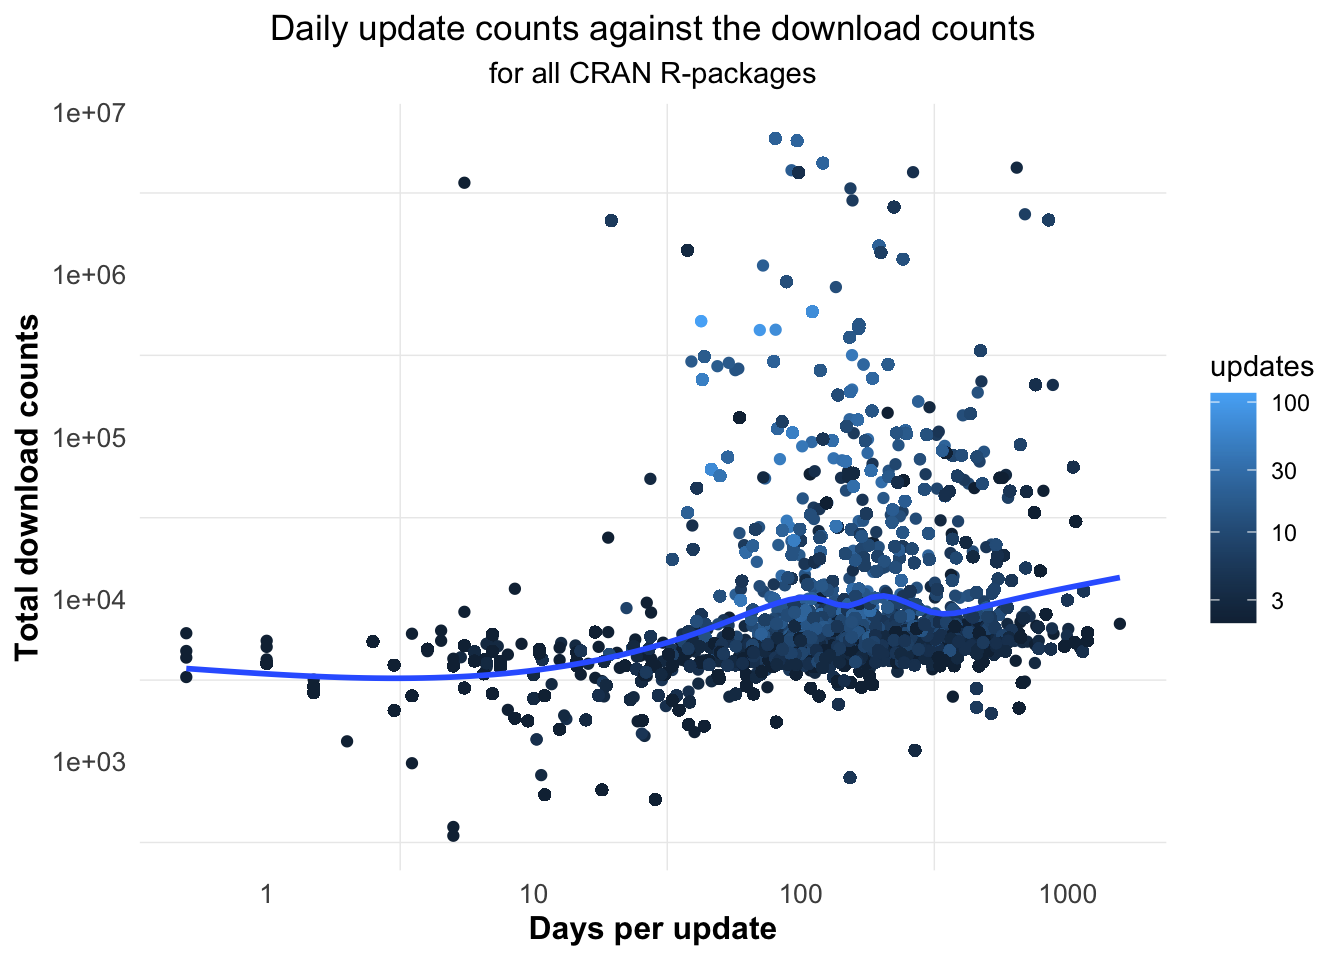
Figure 5.18: Most of the time intervals of updates are between 45 and 450 days.
In conclusion, it’s not that the more updates the R-package has, the popular it will be. In general, most of the R-packages whose updates are lower than the average occupy the majority. Therefore, we can also know that the total number of updates is not very important for the R-package. The important thing is to keep it updated with the time.