5.5 Compare moving average of fable and forecast
Finding: R-package ‘forecast’ has a more stable download trend comparing to ‘fable.’ And when ‘fable’ gets updated, its downloads peaked, while ‘forecast’ suffers a dropping on the contrast.
As we stated in the previous section, the earlier the R-package is released, the easier it is to get a relatively higher total download. But that doesn’t mean a better growth will exist. Due to that, in this section, we compared package fable and forecast. They are two closely related R-packages, for fable is the later released tidy version of forecast. And in this way, we can approximately fix all the factors except the initial release date, so that we can compare the growth and changes of these two more clearly.
Figure 5.11 and Figure 5.12 show the daily download count changing during last half a year, which indicates strong weekly seasonality. And that means the downloads tend to be higher in week days and thus lower on weekends, which is consistent with total R-package trend analyzed before.
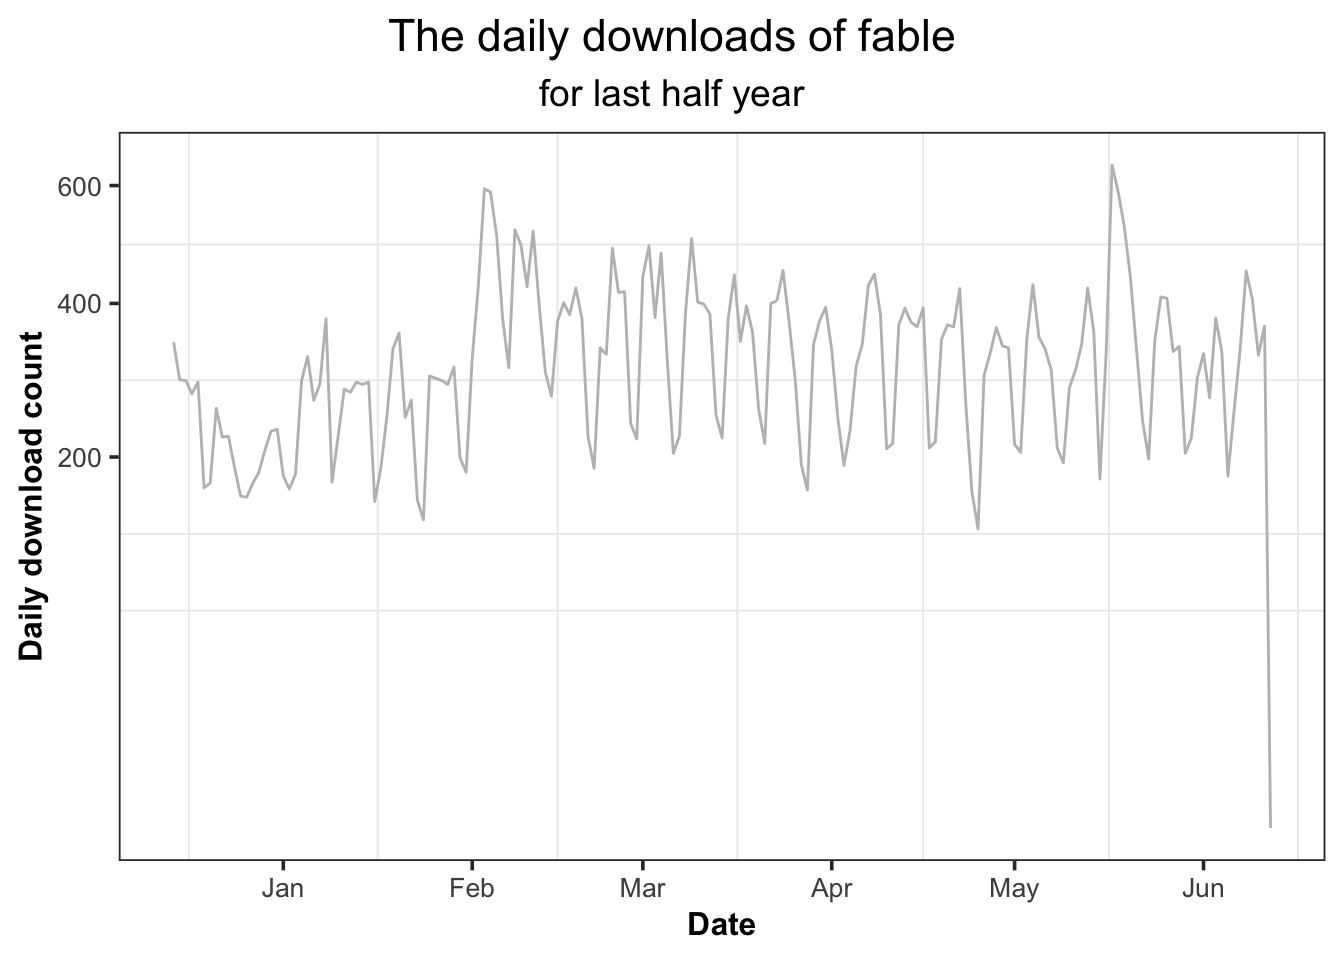
Figure 5.11: The daily download of R-package “fable”
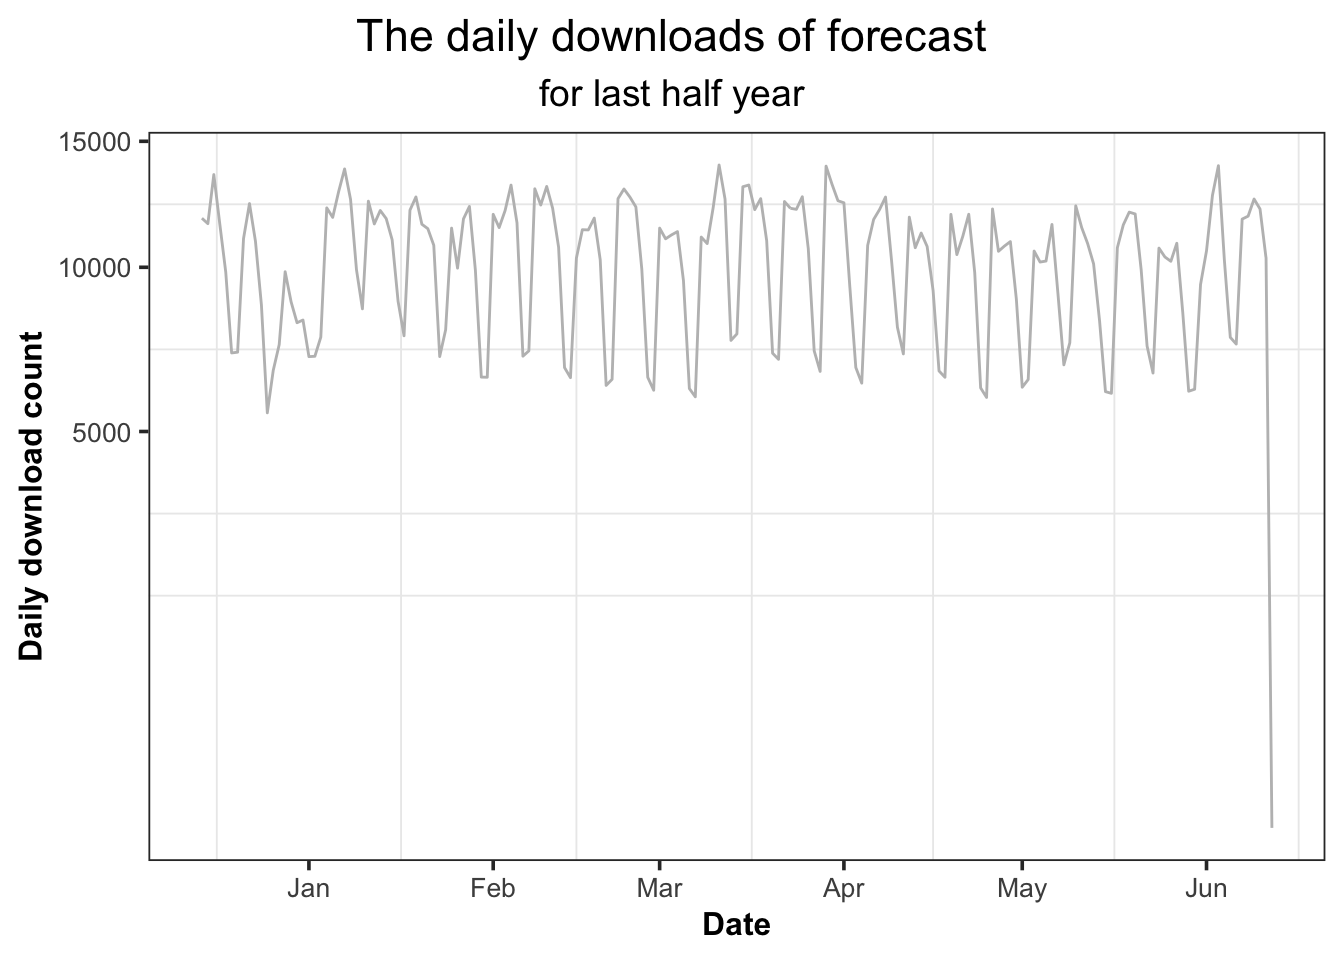
Figure 5.12: The daily download of R-package “forecast.”
Therefore, in order to estimate the trend-cycle and reduce the weekly seasonality to see the changes more clearly, we introduced the Moving Average (MA).
A moving average of order m can be written as :
\[T_t = \frac1m\ \Sigma_{j = -k}^{k}y_{t+j} \]
where m=2k+1. That is, the estimate of the trend-cycle at time t is obtained by averaging values of the time series within k periods of t.
And here, we considered the equal weighed 7 moving average. That is, it calculates the weighted average for every seven consecutive time series with the following weights : [1/7,1/7,1/7,1/7,1/7,1/7,1/7].
Figure 5.13 shows the moving average (MA) of fable and forecast respectively. They have quite different moving average patterns with forecast’s download volume much higher than fable’s. That is, the MA of forecast is relatively stable than that of fable except for the time around New Year’s Eve when forecast has a significant drop. But during that time, a drop also appears in fable, which was probably due to the big New Year holiday. In addition, the purple vertical dashed line in plot of fable marks the update day of it which is on 2021-1-29. And soon after that day, its downloads peaked, which was because the number of download counts will increase on the update day. At the same time, forecast drops and then only gets a gentle increase.
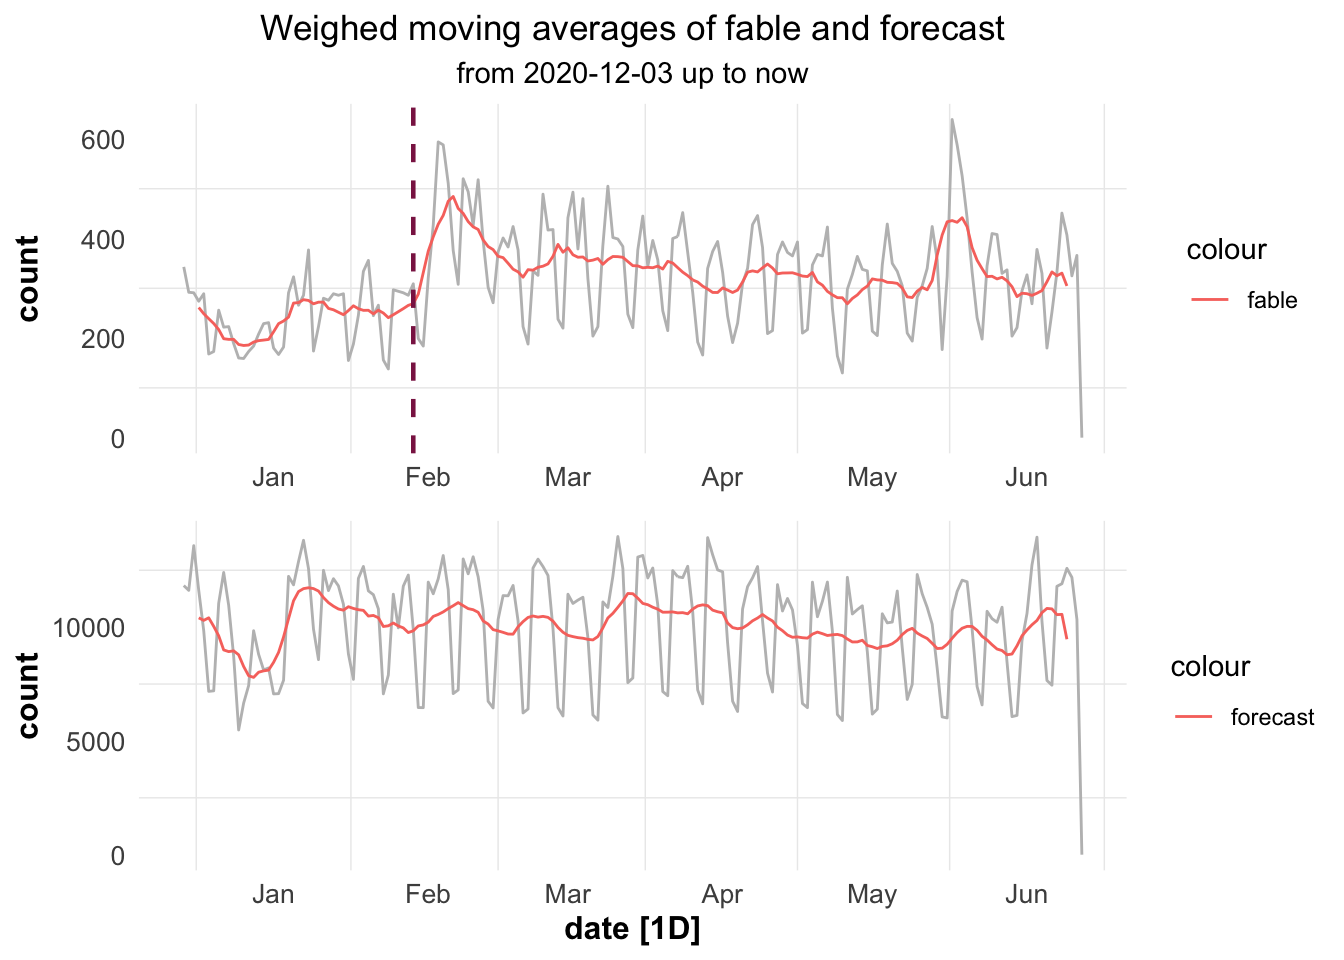
Figure 5.13: The moving average of R-package “forecast” and “fable.”
In conclusion, the download variance of forecast is larger than that of fable while the former looks relatively more stable than the latter after applying the moving average. And once again, it coincides with the conclusion of the previous section, that is, the earlier released R-package tends to gain more cumulative downloads. In addition, we can also see that the growth of both of them sometimes increases at the same time, while sometimes the growth of one corresponds to the decline of the other. As for as we concerned, the shared growth may be due to their similarity. Users may download both at the same time or compare them like us. And the trade-off may also be due to the similarity of their functions, one can be replaced by the other in the process of using. Finally, we can also know that earlier release does not guarantee a faster growth. For example, fable has a more dramatic growth than forecast from 2021-01-21 to 2021-02-06.